

Tata Power Share Price Target 2025: Is a Breakout Above ₹480 on the Horizon?
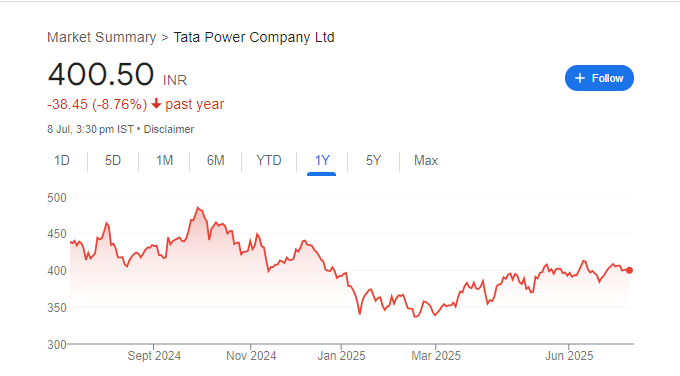
Tata Power (NSE: TATAPOWER) is trading at ₹400.85, down modestly from recent consolidation. Technical analysis shows mixed signals—oscillators are neutral to slightly bearish, but the stock is holding above its 200-day moving average. If it maintains support around ₹395–₹400, a rally to ₹480–₹500 by late 2025 is plausible. A breakdown below ₹390 could trigger a drop to ₹350–₹360.
1. Today’s Technical Snapshot (July 9, 2025)
-
Price: ₹400.85 (–0.09%)
-
52-Week Range: ₹326.35 – ₹494.85
-
RSI (14): ~48.5 – neutral
-
MACD (12,26): –0.73 – slightly bearish
-
Stochastic %K (9,6): ~32.9 – oversold/neutral
-
50-day SMA: ₹395.97 • 200-day SMA: ₹397.79 — current price slightly above long-term SMA
2. Support & Resistance Levels
-
Support Zones:
-
₹395–₹400 (50/200 SMAs) — key pivot cluster
-
₹390 — secondary cushion
-
-
Resistance Levels:
-
₹405–₹410 — near-term pivot zone
-
₹480 — average analyst target (~22% upside)
-
₹500 — bullish extension zone
-
3. Target Outlook for 2025
-
Base-case: ₹480 — reflects analyst consensus and measured rise from pivot
-
Bull-case: ₹500 — achievable if volume and momentum return
-
Bear-case: ₹350–₹360 — risk if price falls below ₹390 and SMAs weaken
4. Risks & Technical Cautions
-
Neutral MACD and near-flat RSI suggest lack of firm momentum
-
Failure to hold ₹395–₹397 could lead to further decline
-
OTC forecast from WalletInvestor targets ₹481 within a year
-
Broader sector disruptions or weak renewables execution may impact trajectory
5. Suggested Trading Strategy
-
Entry Zone: ₹395–₹400 (near pivot and SMAs)
-
Stop-Loss: ₹390 — below support cluster
-
Targets:
-
Primary: ₹480
-
Extension: ₹500
-
-
Confirmation Tip: Look for MACD trending toward crossover and RSI crossing above ~50