

SAIL Share Price Target 2025: Can Technicals Reverse the Current Downtrend?
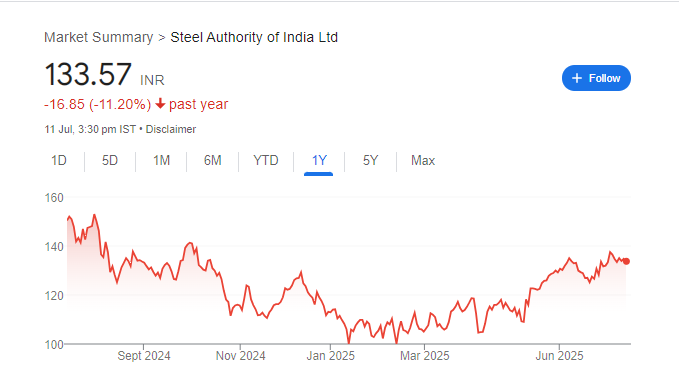
SAIL (NSE: SAIL) is trading at ₹133.57, down ~0.3% today. Technical signals remain mixed: daily charts suggest a Buy, while moving averages and oscillators overall lean Strong Sell, indicating a bearish bias. Analysts’ price targets cluster around ₹120.6 to ₹155, which implies limited upside potential. Unless SAIL reclaims support above ₹140, the outlook stays cautious.
1. Technical Snapshot (July 11, 2025)
| Indicator | Trend / Value | Signal |
|---|---|---|
| Daily Technical Summary | Buy, but weekly/monthly favor Strong Sell | Mixed timeframe strength |
| Moving Averages (5–200‑day) | 4 Buy vs. 8 Sell on moving averages | Bearish bias overall |
| RSI (14) | ~45 — neutral leaning bearish | Lack of momentum |
| MACD & Oscillators | Mixed; lack of clear momentum bias | Trend remains weak |
-
52‑Week Range: ₹99.15 – ₹156.35; price near upper middle band
-
Consensus Analyst Price Target: ₹120.6 average — potential ~10% downside; high estimate ₹155 suggests up to 15% upside, low ₹80 (~40% downside)
-
WalletInvestor projects share price around ₹146 in 12 months — minimal upside (~8%)
2. Support & Resistance Levels
-
Key Support: ₹130–₹132 — recent swing low, below which bearish momentum may accelerate
-
Resistance: ₹136–₹138 — above this zone may challenge ₹140 test zone
-
Upside Potential: ₹155 — high-end analyst target; break above ₹140 may lead there
-
Downside Risk: ₹120–₹125 — if major support fails, aligning with low-end analyst targets
3. Price Target Outlook for 2025
| Scenario | Target Price | Conditions |
|---|---|---|
| Base-case | ₹120–₹125 | Price drifts lower, confirming bearish technicals |
| Neutral | ₹134–₹140 | Consolidation; holding current levels |
| Bull-case | ₹150–₹155 | Recovery above ₹138/₹140 and shift in technical bias |
4. Risks & Technical Warning Signs
-
Technical indicators remain weak overall: strong sell signals on weekly/monthly frames, more Sell than Buy across MAs
-
Break below ₹130 may trigger further decline toward ₹120
-
Lack of momentum in RSI and MACD — no reversal confirmation yet
-
High analyst dispersion — some expect ₹155 but others tag ₹80; uncertainty remains
5. Suggested Trading Strategy
-
Watch for rebounds near ₹130 support; aggressive longs only if price breaks above ₹138 with volume confirmation
-
Stop-loss levels: ₹128 (breaks pivot) or ₹140 (for bullish plays to minimize risk)
-
Stretch target: ₹150–₹155 if momentum and chart structure shift positive
-
Risk strategy: Avoid new longs without clear technical reversal—use tight stops and scale in cautiously