

RattanIndia Power Share Price Target 2025: Stellar Technical Signal – Can It Sustain the Rally?
RattanIndia Power (NSE: RTNPOWER) is trading at ₹16, up nearly 8% today, showing strong bullish technical momentum. Key indicators like RSI (~71), MACD, and ADX are all signaling strength. With pivot-based support clear and moving averages confirming an uptrend, the stock could aim for ₹18–₹19 by late 2025, barring a drop below ₹15.50.
1. Today’s Technical Overview
-
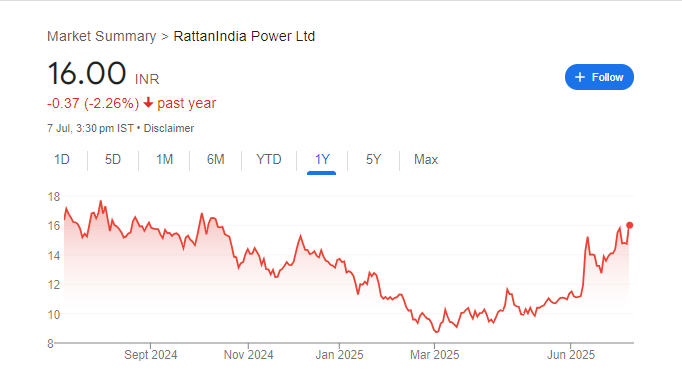
Price: ₹16 (+7.93%)
-
52‑Week Range: ₹8.44 – ₹17.95
-
RSI (14): ~71.4 – Overbought but dominant bullishness
-
MACD: +0.17 – Bullish crossover
-
ADX: ~40 – Very strong trend
-
Stochastic: ~58 – Supports continuation
-
Moving Averages (5/10/20/50/100/200): All “Buy” – strong bullish alignment
Overall: Technicals align strongly: daily, weekly, monthly charts all mark “Strong Buy” on momentum and moving averages.
2. Support & Resistance Levels
-
Key Support Zones:
• ₹15.52 – volume-packed support level
• ₹15.50 – close to recent pivot low -
Resistance Zones:
• Near-term: ₹17.11 (Classic R2) & ₹16.51 (Pivot R2)
• Longer-term: ₹18.00–₹19.00 – next target range if momentum holds
3. Price Target Outlook by End‑2025
-
Base-case: ₹18.00 – aligns with pivot resistance and maintaining current trend
-
Bull-case: ₹19.00 – possible if momentum continues toward 52-week highs
-
Stop-Loss Action: Drop under ₹15.50 invalidates bullish stance; watch for fallback to ₹14.90–₹15.00
4. Risks & Technical Watchpoints
-
Overbought RSI (~71) may cause short-term consolidation
-
Volume & momentum pullback could stall rally
-
Support breach under ₹15.50 invalidates bullish scenario
-
Macro/Power-sector headwinds (regulations, tariffs, fuel prices) may weigh on trend
5. Suggested Trading Strategy
-
Entry Point: ₹16.00–₹16.50 (on minor pullback or consolidation)
-
Stop-Loss: ₹15.45–₹15.50 (just beneath pivot support)
-
Targets: ₹18.00 → ₹19.00 (base and bull scenarios)