

Exicom Share Price Target 2025: Technical Forecast & Trading Outlook
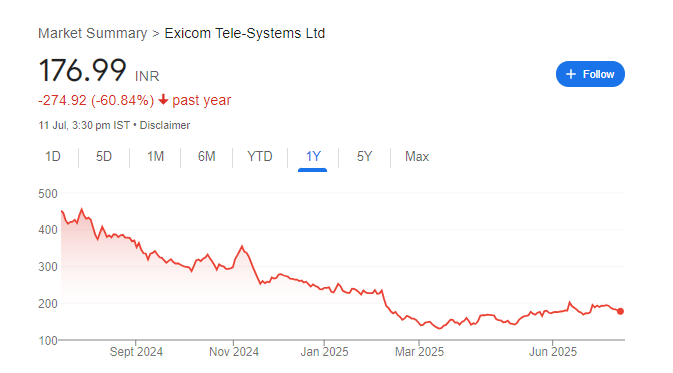
Current stock snapshot: ₹176.99 (NSE: EXICOM) — approximately 60% below its 52‑week high around ₹466 but still above its 52‑week low (~₹125)
1. Market Overview & Context
-
Company: Exicom Tele‑Systems Ltd — provider of critical power solutions and EV chargers
-
Business segments and recent Q4 performance: consecutive quarterly losses, including ~₹62 crore net loss
2. Technical Indicator Summary
-
Daily Trend: Strong Sell across multiple timeframes
-
Moving Averages: All spanning MA5 to MA200 show Sell signals—0 buy signals total
-
RSI (14): ~21.7 → Oversold
-
MACD: –3.49 → Sell
-
Other Indicators: ADX, CCI, Williams %R, ROC all signaling sell/oversold
3. Pivot Points & Levels
-
Pivot (Classic/Fibonacci/Camarilla): ~₹177.66
-
Support Zones: Rpivots and volume-based support around ₹174.00 and ₹173.94
-
Resistance Areas: ~₹183.45 (volume-based), ~₹187.99–₹190 region where MAs cluster → potential resistance on rise
4. Price Target Scenarios for 2025
Base Forecast (Technical Outlook)
Current technical picture suggests cautious view with short-term rebound possible if support holds:
-
Target Zone A (Short-term bounce): ₹183 – ₹188 (if support at ~₹174 holds)
-
Target Zone B (Medium term recovery): ₹190 – ₹205 (breaking above MA200 / resistance)
-
3‑Month Upside Potential: +18% range (~₹206–₹265) per StockInvest.us model
Broker / Analyst Consensus (if any)
-
No current visible analyst target due to negative sentiment; but peer valuation and industry P/E (~105x vs Exicom’s negative P/E) suggest valuation gap
5. Technical Interpretation & Trading Strategy
-
Oversold Condition (RSI ~21): short-term bounce may be possible
-
But MA trend remains firmly bearish: all moving averages signal sell → requires sustained positive trigger for technical reversal
-
Watch support: support near ₹174‑₹175; breach may lead to further downside
-
Break above resistance zone (~₹183‑190) could offer entry for speculative bounce
6. Risks & Cautionary Points
-
Consecutive loss-making quarters; weak fundamentals
-
High beta (~1.2) and volatility — share moved ~−60% in past year
-
Earnings, liquidity, and rights issue developments may significantly alter technical posture
7. Summary Table
| Metric | Value / Outlook |
|---|---|
| Current Price | ₹177.22 (as on July 11, 2025) |
| Overall Technical Bias | Strong Sell / Oversold |
| Key Support Levels | ₹174 – ₹173.94 |
| Resistance Levels | ₹183–₹188, ₹190–₹205 |
| Short-Term Recovery Target | ₹183–₹188 |
| Medium-Term Recovery Potential | ₹190–₹205 |
| High-Probability Upside (per model) | ₹206–₹265 in 3 months |
| Risks | Continuing losses, rights issue dilution, sector volatility |