
ITC Share Price Target 2025: Is a Bounce from ₹413 on the Cards?
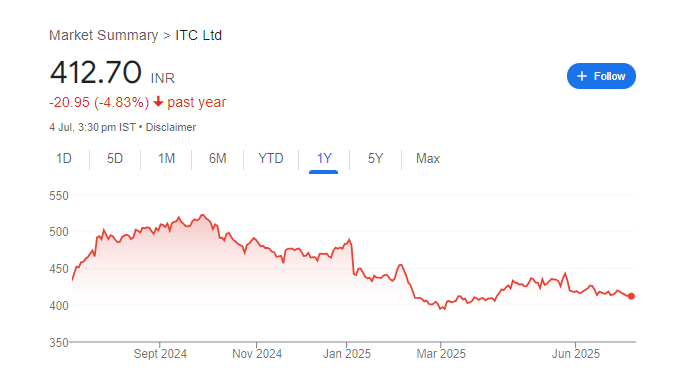
ITC Ltd (NSE: ITC) is currently trading around ₹412.55, near its 52-week low. Technical indicators suggest a neutral-to-bearish pullback—but a clear breakout above ₹445–₹450 could pave the way for an upside move to ₹500–₹530 by late 2025.
1. Today’s Market Snapshot
-
Price: ₹412.55 (near session close)
-
52‑Week Range: ₹390.15 – ₹528.50
-
Technical Rating: “Strong Sell” on daily and weekly charts
2. Technical Indicator Overview
| Indicator | Value | Signal |
|---|---|---|
| RSI (14) | ~42 | Neutral-to-bearish |
| MACD | –0.87 | Bearish |
| Stochastic %K | ~26.6 | Oversold region |
| 50-/200-day MAs | ~₹416 / ₹419 | Price below both, bearish |
| Pivot Support Zones | ₹410–₹411 | Critical area |
Current view: the stock is oversold but remains under short- and long-term moving average resistance.
3. Support & Resistance Zones
-
Support Range: ₹410–₹413 (near recent Pivot S/F support)
-
First Resistance: ₹445–₹450 (short-term SMA/pivot alignment)
-
Upside Targets: ₹500 → ₹530 (if price breaks above ₹450)
4. Share Price Target Outlook for 2025
-
Base‑case: ₹500 — assuming a rebound above the ₹445 zone
-
Bull‑case: ₹530 – if MACD turns bullish and RSI holds above 50
-
Downside Risk: A fall below ₹410 could lead to a slide toward ₹390
5. Risks & Technical Cautions
-
Strong Sell on trend ratings suggest continued weak momentum
-
MACD remains negative, without bullish crossover
-
Price below both MAs could mean further consolidation or downside
-
Sector or regulatory shocks (tobacco taxes/regulations) pose additional risk
6. Suggested Trading Strategy
-
Entry Zone: ₹413–₹416 (near support and pivot level)
-
Stop‑Loss: ₹407 (below Pivot S2)
-
Targets: First ₹500, then ₹530—on positive MACD reversal and breakout above 445–450