

REC Share Price Target 2025: Will Technicals Spark a Rebound from ₹390 Pivot?
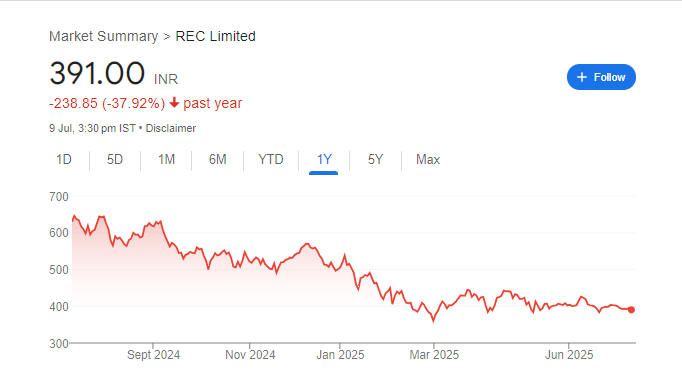
REC Ltd (NSE: RECLTD) is trading at ₹391.55, down ~0.9% today. Technical indicators are overwhelmingly bearish: moving averages and oscillators show a clear Strong Sell trend. To turn the tide, REC must hold above ₹390, or it may descend to ₹360–₹370. If it stabilizes, a rebound toward ₹450–₹500 by end‑2025 could materialize.
1. Current Technical Snapshot (July 9, 2025)
-
Price: ₹391.55 (–₹3.55, –0.9%)
-
52‑Week Range: ₹357.35 – ₹654.00
-
Moving Averages (5–200‑day): All in Sell mode
-
Oscillators:
-
RSI (14): 43.6 — bearish
-
MACD: –0.68 — bearish
-
Stochastic: 37.8 — bearish
-
Bottom‑line: Technical signals are strongly negative; weekly and monthly charts also show a sell bias.
2. Support & Resistance Levels
-
Key Support: ₹390–₹392 – just below is pivot area according to classic and Fibonacci models
-
Critical Breakzone: A decisive move below ₹390 could trigger a slide to ₹360–₹370
-
Upside Resistance: ₹420–₹440 — potential rebound levels if momentum shifts
3. Share Price Target Scenarios for 2025
| Scenario | Target Range | Conditions |
|---|---|---|
| Base‑case | ₹360–₹370 | Break of ₹390 support triggers a drop |
| Rebound | ₹450–₹500 | Requires holding above ₹390 + trend reversal |
| Bear-case | ₹330–₹350 | Sustained technical weakness under ₹360 |
A bullish pivot breakout around ₹420+ could reignite a rally toward ₹500.
4. Risks & Technical Triggers
-
Persistent bearish signals — 0 Buy readings in both moving averages and indicators
-
A breakdown below ₹390 opens path toward ₹360
-
Sector pressure (interest rates, rural credit trends) could reinforce the downtrend
5. Suggested Trading Strategy
-
Rebound play: Buy around ₹395–₹400, once price holds and detecting a MACD RSI uptick
-
Stop‑Loss: ₹388 (below pivot)
-
Targets: ₹450 → ₹500
-
Alternative: Short/break-trade below ₹389 → initial ₹370, then ₹350