

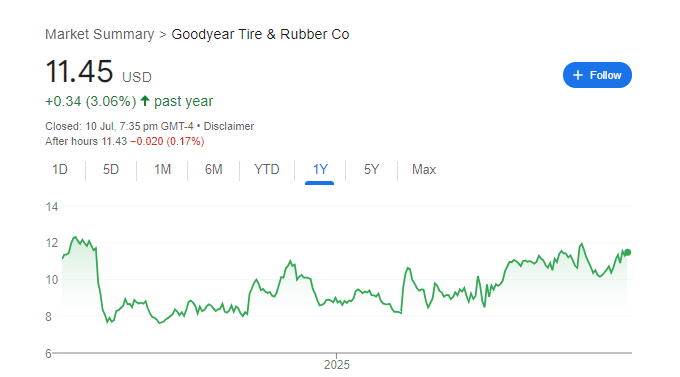
Goodyear (GT) Share Price Target 2025: Can Technicals Support Gains Toward $15?
Goodyear Tire & Rubber (NASDAQ: GT) is trading at $11.45 today. The stock has recently shown improved technical strength — its Relative Strength (RS) Rating is now in the 80s, suggesting growing price leadership. Technical indicators are mixed-to-positive. With support holding near $11.10–$11.30 and signs of momentum building, there’s potential for a move toward $13.50–$15.00 by late 2025. A breakdown below $11.10 could shift trajectory toward $10.00–$10.50.
1. Technical Snapshot (Today’s Data, July 11, 2025)
-
RS Rating: ~85 — strong relative strength among peers
-
MACD (12,26): +0.05 — bullish crossover though mild
-
RSI (14): ~51 — neutral momentum
-
Stochastic %K: ~37 — neutral/bearish short-term
-
Moving Averages: MA5 & MA50 positive; mid‑term bias bullish, though MA20/MA10 slightly negative
-
Trend Signal: Daily summary signals Strong Buy, while broader timeframe signals are mixed
2. Support & Resistance & Pivot Zones
-
Support:
-
$11.10 — 50-day MA support and daily pivot zone
-
$11.00 — psychological level / minor pivot
-
-
Resistance:
-
$11.30–$11.45 — recent highs and swing resistance
-
$12.00–$12.50 — breakout zone enabling further rally
-
-
Stretch upside: $13.50 → $15.00 if momentum builds and fundamentals support price
3. Price Target Outlook for 2025
| Scenario | Target | Conditions |
|---|---|---|
| Base Case | $13.50 | Holding above $11.10 pivot with modest momentum pickup |
| Bull Case | $15.00 | Sustained breakout above $12.50 along with strong volume |
| Bear Case | $10.00–$10.50 | Reversal below $11.00 pivot invalidates bullish setup |
Analyst consensus price targets average near $15, reflecting ~30% upside from current prices .
4. Risks & Technical Caution Areas
-
RSI & MACD are neutral — momentum hasn’t fully ratified trend reversal
-
Overextended stochastic risks short-term pullback after recent upper band breach
-
Failed breakout near $12.50 or breakdown under pivot zone could reverse near-term bias
-
Upcoming earnings (around Aug 1) could act as catalyst or trigger volatility
5. Suggested Trading Strategy
-
Position Play Entry: $11.20–$11.30 — near pivot support or upon daily close above $11.45 breakout
-
Stop‑Loss: $11.00 — under the key pivot support zone
-
Targets:
-
Intermediate: $13.50
-
Stretch: $15.00
-
-
Confirmation: Prefer entries on volume-supported rises and MACD histogram expansion